monkeybread.plot.shortest_distances_pairwise
- monkeybread.plot.shortest_distances_pairwise(g1_to_g2_to_pval, cmap='viridis_r', annot=True, fmt='.2f', order_x=None, order_y=None, figsize=None, show=True, ax=None, fig=None, **kwargs)
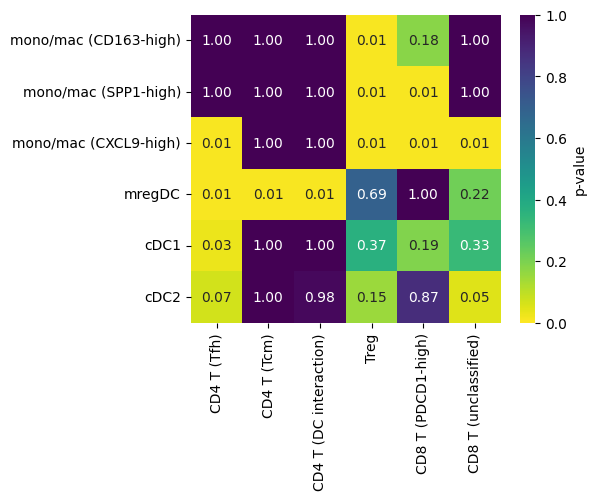
Plot a heatmap of the p-values calculated by
monkeybread.stat.shortest_distances_pairwise()that is the result of testing the co-localization between every cell type in one set to every cell type in a second set (e.g., myeloid cell types to T cell subtypes).- Parameters:
g1_to_g2_to_pval (
Dict[str,Dict[str,float]]) – A dictionary mapping each cell type in one set to a cell type in a second set to a p-value describing the signficance of their co-localization. This data structure is output bymonkeybread.stat.shortest_distances_pairwise().cmap (
Optional[str] (default:'viridis_r')) – Colormap used to color the heatmap.annot (
Optional[bool] (default:True)) – If True, annotate the heatmap.fmt (
Optional[str] (default:'.2f')) – String format used to annotate the heatmap.order_x (
Optional[List[str]] (default:None)) – Order of labels along the x-axis (keys of the inner-dictionary within theg1_to_g2_to_pvalargument.order_y (
Optional[List[str]] (default:None)) – Order of labels along the y-axis (keys of the outer-dictionary within theg1_to_g2_to_pvalargument.figsize (
Optional[Tuple[float,float]] (default:None)) – Dimensions of figureshow (
Optional[bool] (default:True)) – If True, show the plot and don’t return theplt.Axesobject.ax (
Optional[Axes] (default:None)) –plt.Axesobject to plot tofig (
Optional[Figure] (default:None)) –plt.Figureobject to plot tokwargs – Keyword arguments to pass to
seaborn.heatmap().
- Return type:
- Returns:
: If
show = False, returns nothing. Otherwise, returns a single Axes object or a tuple of two Axes objects if expected_distances is provided.
Example