monkeybread.plot.neighbors_profile_matrixplot
- monkeybread.plot.neighbors_profile_matrixplot(adata_neighbors, niche_key, include_niches=None, show=True, clustermap_kwargs=None)
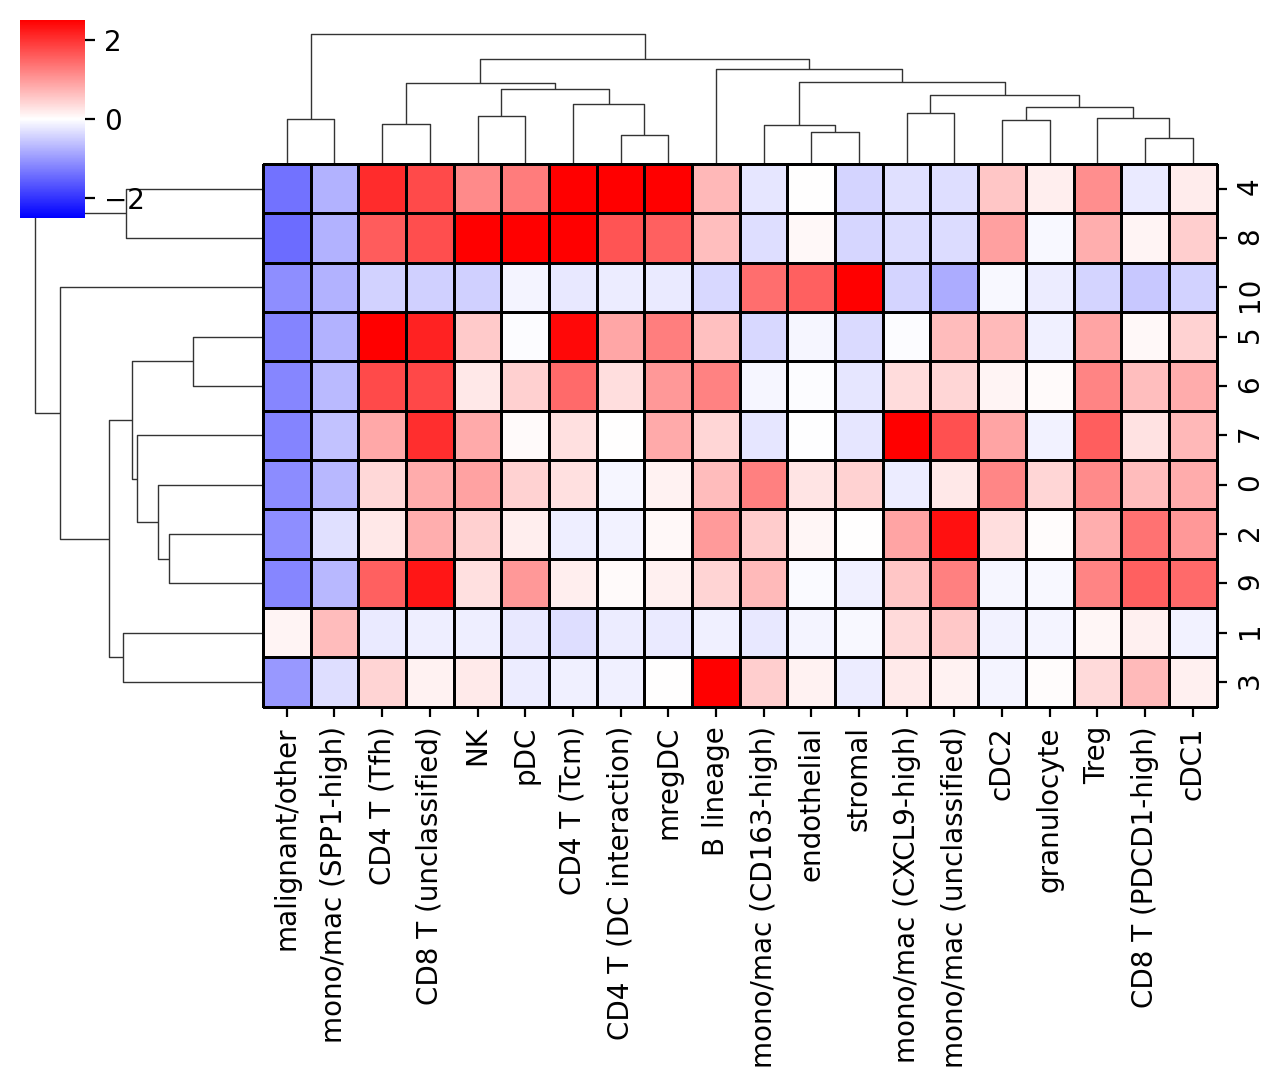
Heatmap plotting the mean, normalized neighbor count of each cell type within each niche.
- Parameters:
adata – Annotated data matrix storing the neighborhood profiles. This data structure is generated by
monkeybread.calc.neighborhood_profile()or bymonkeybread.calc.cellular_niches()niche_key (
str) – Column name inadata_neighbors.obsstoring the niche assigned to each cellinclude_niches (
Optional[List[str]] (default:None)) – List of niche IDs (values inadata_neighbors.obs[niche_key]) to include in the plotshow (
Optional[bool] (default:True)) – If True, show the figureclustermap_kwargs (
Optional[Dict] (default:None)) – Keyword arguments passed toseaborn.clustermap
- Returns:
: A
seaborn.ClusterGridinstance
Example