monkeybread.plot.embedding_zoom
- monkeybread.plot.embedding_zoom(adata, left_pct=None, top_pct=None, width_pct=None, height_pct=None, color=None, mask=None, basis='spatial', show=True, unzoom_s=None, zoom_s=None, axs=None, fig=None, **kwargs)
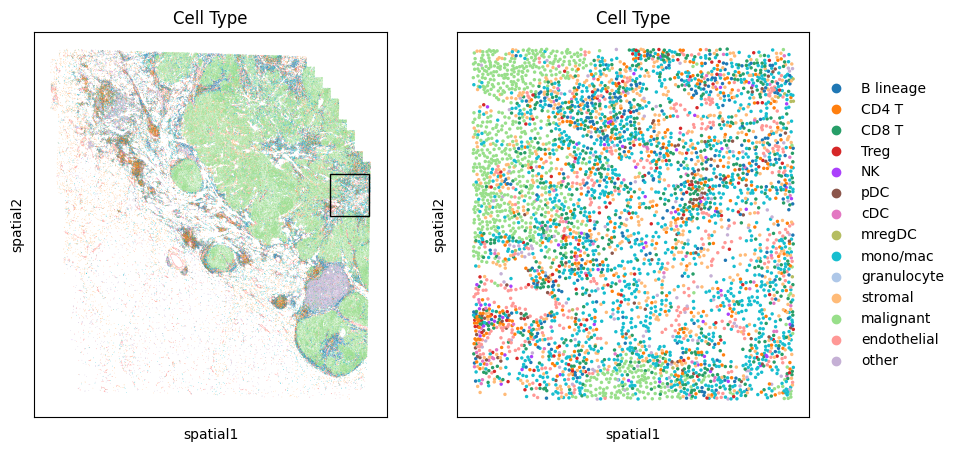
Shows embeddings of cells neighboring other cells with zoomed focus.
Plots the results of
monkeybread.calc.cell_neighbors(), highlighting the cell neighbors. Zooms in on a specific rectangle in the plot, based on fractional coordinate space, for higher-resolution viewing.- Parameters:
adata (
AnnData) – Annotated data matrix.left_pct (
Optional[float] (default:None)) – The fraction of the plot width to use as the left bound of the zoomed-in rectangle, e.g. 0.1 represents 10% from the left of the plot.top_pct (
Optional[float] (default:None)) – The fraction of the plot height to use as the upper bound of the zoomed-in rectangle, e.g. 0.3 represents 30% from the top of the plot.width_pct (
Optional[float] (default:None)) – The fraction of the plot width to use for the zoomed-in rectangle, e.g. 0.5 represents a width half of the original plot.height_pct (
Optional[float] (default:None)) – The fraction of the plot height to use for the zoomed-in rectangle, e.g. 0.25 represents a height 25% of the original plot.color (
Optional[str] (default:None)) – Column inadata.obsused to color cells.mask (
Union[List[bool],List[str],None] (default:None)) – A mask to apply toadata.obs.index. Can be a list of cell indices or a boolean mask with the same length as the index, as described inmonkeybread.plot.embedding_filter().basis (
Optional[str] (default:'spatial')) – Coordinates inadata.obsm[X_{basis}]to use. Defaults tospatial.show (
Optional[bool] (default:True)) – Whether to show the plot or return the Axes object.unzoom_s (
Optional[float] (default:None)) – Dot-size in the zoomed-out figure passed toscanpy.pl.embedding().zoom_s (
Optional[float] (default:None)) – Dot-size in the zoomed-in figure passed toscanpy.pl.embedding().kwargs – Keyword arguments that will be passed to
scanpy.pl.embedding().
- Return type:
- Returns:
: If
show = True, returns nothing. Otherwise, returns the Figure object the plots are contained within.
Example