monkeybread.plot.shortest_distances
- monkeybread.plot.shortest_distances(observed_distances, expected_distances=None, show=True, **kwargs)
Plot the distribution of observed distances from each cell in one group (e.g., all T cells) to its closest cell in a second group (e.g., all macrophages) as calculated by
monkeybread.calc.shortest_distances().Optionally, also plot the null distribution of these distances under the null hypothesis that the two cell types do not co-locate. This null distribution must first be computed by
monkeybread.stat.shortest_distances().- Parameters:
observed_distances (
DataFrame) – The observed shortest distances, as calculated bymonkeybread.calc.shortest_distances().expected_distances (
Union[ndarray,Tuple[ndarray,float,float],None] (default:None)) – The expected distances under the null hypothesis that the two cell types do not co-locate. Optional to include the distance threshold and p-value, as calculated bymonkeybread.stat.shortest_distances().show (
Optional[bool] (default:True)) – If true, displays the plot(s). If false, returns the Axes instead.kwargs – Keyword arguments to pass to
seaborn.histplot().
- Return type:
- Returns:
: If
show = False, returns nothing. Otherwise, returns a single Axes object or a tuple of two Axes objects if expected_distances is provided.
Example
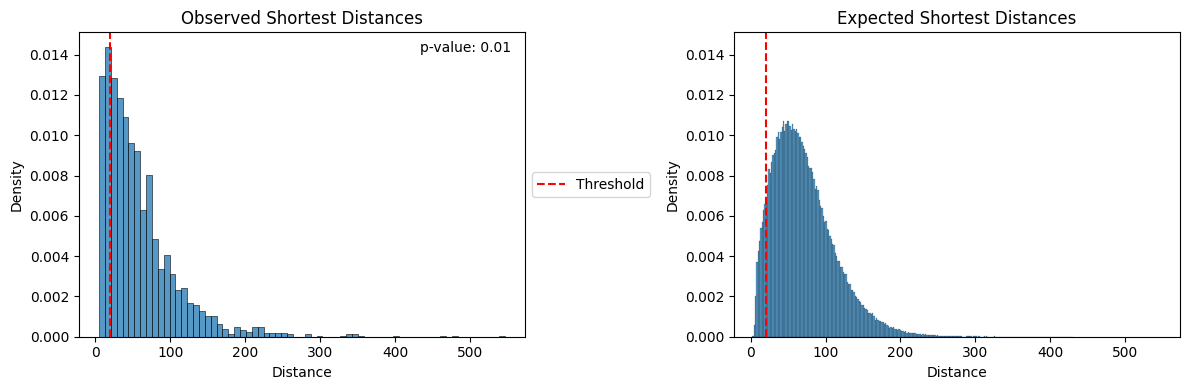
In the left-hand figure, we plot the distribution of distances between each cell in the first group to its closest cell in the second group. The right-hand plot shows the expected distribution under the null hypothesis that cells do not co-locate. The vertical red line denotes the distance threshold used to compute the test-statistic described by the p-value from
monkeybread.stat.shortest_distances().