monkeybread.plot.ligand_receptor_scatter
- monkeybread.plot.ligand_receptor_scatter(actual_scores, stat_scores, lr_pairs=None, show=True, ax=None, **kwargs)
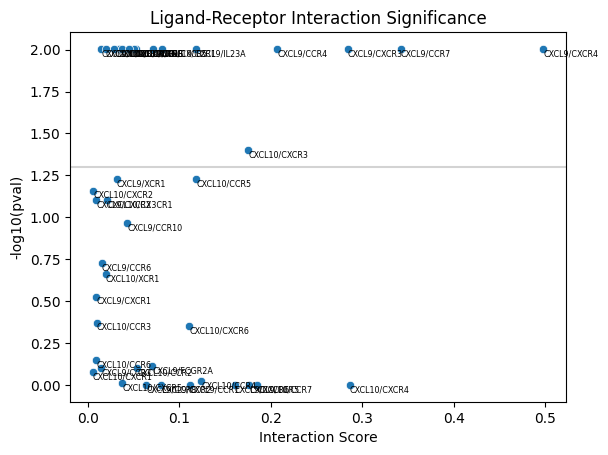
Plots a scatterplot highlighting the observed ligand-receptor scores and significance.
Uses the results of
monkeybread.calc.ligand_receptor_score()andmonkeybread.stat.ligand_receptor_score().Creates a scatterplot where each point is one ligand-receptor pair, the x-axis displays the observed score, and the y-axis displays the p-value from the statistical test.
- Parameters:
actual_scores (
Dict[Tuple[str,str],float]) – The observed scores, as calculated bymonkeybread.calc.ligand_receptor_score().stat_scores (
Dict[Tuple[str,str],Tuple[ndarray,float]]) – The permuted scores, as calculated bymonkeybread.stat.ligand_receptor_score().lr_pairs (
Union[Tuple[str,str],List[Tuple[str,str]],None] (default:None)) – A subset of ligand-receptor pairs fromactual_scoresandstat_scoresto plot.show (
Optional[bool] (default:True)) – Whether to show the plot or return the Axes object.ax (
Optional[Axes] (default:None)) – An Axes object to add the plots to.kwargs – Keyword arguments that will be passed to
seaborn.histplot.
- Return type:
- Returns:
: If
show = True, returns nothing. Otherwise, returns the Axes object the plot is contained within.
Example