monkeybread.plot.cell_density
- monkeybread.plot.cell_density(adata, key, spot_size=None, alpha=1.0, cmap=None, legend_loc='right margin', show=True, title=None, ax=None)
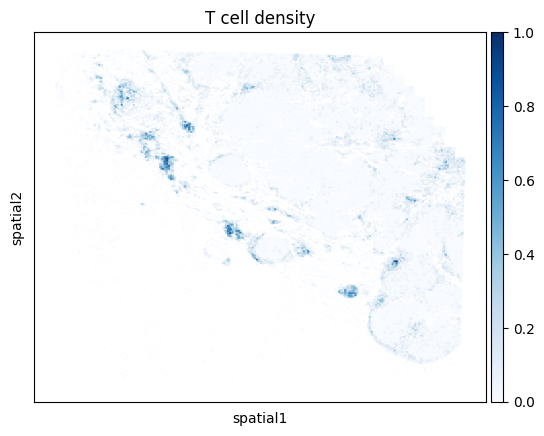
Plots the spatial density of cells across the tissue, as calculated by
monkeybread.calc.cell_density().- Parameters:
adata (
Union[AnnData,Series,Dict[str,Series]]) – Annotated data matrixkey (
Union[str,Dict[str,str]]) – Either a key inadata.obsor a mapping of group names to keys inadata.obscorresponding to density columnsspot_size (
Optional[float] (default:None)) – The size of spots to plotalpha (
Optional[float] (default:1.0)) – The alpha blending value, between 0 (transparent) and 1 (opaque).cmap (
Optional[str] (default:None)) – Colormap to use for values 0 to 1show_legend – If
Trueshow the legend. Otherwise, hide it.show (
Optional[bool] (default:True)) – Whether to show the plot or return itax (
Optional[Axes] (default:None)) – An Axes object to add the plot to. Only works ifkeyis a single key.
- Return type:
- Returns:
: If
show = Falsereturns the current figure (ifkeyis a mapping) or the current axes (ifkeyis a string). Ifshow = Truereturns nothing.
Example