monkeybread.plot.location_and_density
- monkeybread.plot.location_and_density(adata, groupby, groups, groupnames=None, plot_density=True, resolution=10, bandwsith=75, dot_size=7, na_dot_size=1.5, title=None, grid=True, n_grids=5, palette=None, delete_temp_columns=False, show=True)
A wrapper around both
scanpy.pl.embedding()andmonkeybread.calc.cell_density()that creates multi-panel figures showing both the raw location of cells of a given cell type, by callingscanpy.pl.embedding()and their density across the tissue by callingmonkeybread.calc.cell_density().- Parameters:
adata (
AnnData) – Annotated data matrix.groupby (
str) – A key inadata.obsthat store the cell type labels to be plotted.groups (
Union[str,List[str],List[List[str]]]) – Either a single cell type label inadata.obs[{key}], a list of cell type labels inadata.obs[{key}], or a list of lists of cell type labels inadata.obs[{key}]. If provided a list of lists, then each sub-list is considered one cell type and a union of all labels in that sublist will be used to group the cells (e.g., [[‘CD4 memory T cell’, ‘CD4 naive T cell’], [‘CD8 memory T cell’, ‘CD8 naive T cell’]] encodes two groups of cells: CD4 T cells and CD8 T cells)groupnames (
Union[str,List[str],None] (default:None)) – Ifgroupsis a list of lists, then this list of groupnames stores a list of strings corresponding to each sublist and is used to label the cells in that group. (e.g., in the example above, such a list might be [‘CD4 T cell’, ‘CD8 T cell’] that will label the CD4 and CD8 T cells)plot_density (
Optional[bool] (default:True)) – Plot the density plots alongside the embedding plot.resolution (
Optional[bool] (default:10)) – Resolution parameter to pass tomonkeybread.calc.cell_density()bandwidth – Bandwidth parameter to pass to
monkeybread.calc.cell_density()dot_size (
Union[float,List[float],None] (default:7)) – The size of dots in the embedding for the cells of intests (specified ingroups). To plot each group with a different dot size, a list of sizes can be provided.na_dot_size (
Optional[float] (default:1.5)) – The size of dots in the embedding for cells that are not of interest (specified ingroups)title (
Optional[str] (default:None)) – Title of the first figure showing the embedding of all of the cells together in one plot.grid (
Optional[bool] (default:True)) – IfTrue, draw grid lines in each plotn_grids (
Optional[int] (default:5)) – Number of gridlines to be drawn ifgridisTruepalette (
Optional[List[str]] (default:None)) – Color palette used to color each groupdelete_temp_columns (
Optional[bool] (default:False)) – Delete columns added toadata.obsthat were added during the creation of these plots.show (
Optional[bool] (default:True)) – IfTruedisplay the figure. Otherwise return theplt.Figureandplt.Axesobjects.
- Return type:
- Returns:
: If
show = Falsereturns the current figure and axes. Ifshow = Truereturns nothing.
Example
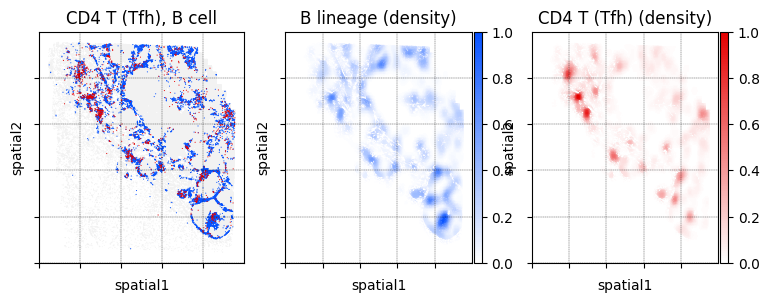
The left-most figure displays the locations of B cells (red) and CD4 Tfh cells (blue) in the tissue. The center and right-most figures display the density of B cells and CD4 Tfh cells, respectively, across the tissue.