monkeybread.plot.ligand_receptor_embedding
- monkeybread.plot.ligand_receptor_embedding(adata, lr_pair, cell_to_neighbor, color, basis='X_spatial', palette=None, cmap_name='magma_r', encode_lw=True, max_lw=3.0, lr_colorbar=True, ax=None, show=True, **kwargs)
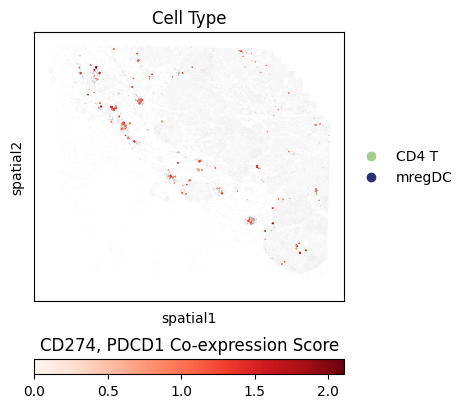
Plot the ligand-receptor co-expression score between pairs of neighboring cells. A line is drawn between each pair of neighbors cells where that line is colored according to the magnitude of their ligand-receptor co-expression score.
The ligand-receptor score is described in [HBB+22]. For a given pair of cells, it is expressed as
sqrt(l*r)wherelis the expression of the ligand andris the expression of the receptor.- Parameters:
adata (
AnnData) – Annotated data matrix.cell_to_neighbor (
Dict[str,Set[str]]) – A mapping of each cell to its neighbors, as calculated bymonkeybread.calc.cell_neighbors().lr_pair (
Tuple[str,str]) – A ligand-receptor pair where the ligand is expressed in the cells that act as keys in thecell_to_neighbordictonary argument and the receptor is is expressed in the cells that are values in thecell_to_neighbordictonary argument.color (
str) – Column inadata.obsused to color cells.basis (
Optional[str] (default:'X_spatial')) – Coordinates inadata.obsm[{basis}]to use. Defaults tospatial.palette (
Optional[str] (default:None)) – Palette used to color cellscmap_name (
Optional[str] (default:'magma_r')) – Colormap used to color lines connecting cells to their neighborsencode_lw (
Optional[bool] (default:True)) – Draw the width of each line connecting neighboring cells according to the magnitude of their ligand-receptor score. Neighboring cells with a low ligand-receptor co-expression score will be connected by a thinly drawn line whereas a pair of cells with a high ligand-receptor co-expression score will be connected by a thickly drawn line. IfFalse, all lines will be drawn with equal thickness defined by themax_lwargument.max_lw (
Optional[float] (default:3.0)) – Ifencode_lw = True, this is thickness of the line connecting the pair of cells with maximum ligand-receptor score. Ifencode_lw = False, this is the thickness connecting all pairs of neighboring cells.lr_colorbar (
Optional[bool] (default:True)) – IfTruedraw a colorbar depicting the ligand-receptor scores. IfFalse, hide this colorbarshow (
Optional[bool] (default:True)) – Whether to show the plot or return the Axes object.kwargs – Keyword arguments that will be passed to
monkeybread.plot.embedding_zoom().
- Return type:
- Returns:
: If
show = True, returns nothing. Otherwise, returns the Figure and Axes containing the figure.
Example